Main Page
Top Level Screen
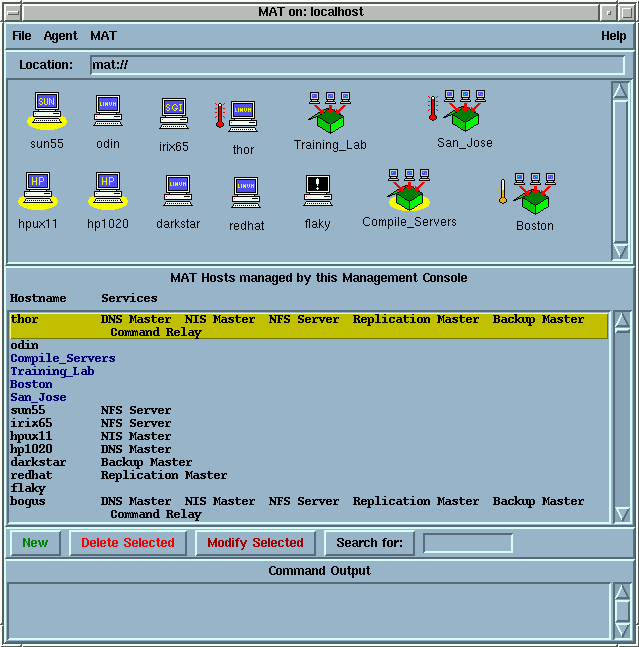
This is the MATtool top level view. It provides a hierarchical depiction of the computing resources within an organization. The sample view below shows how the MATtool provides a quick way of identifying systems with problems. The temperature gauge on San Jose group shows that one or more hosts in that group has a problem. A small host icon with black screen indicates that one or more hosts in the group is down. Host Flaky is down. Each console user can have their own customized view of the hosts tailored to their roles.![]()
![]() The yellow circle indicates that the host or group has been selected.
MAT commands that are run when more than one item is selected will be run
on ALL selected hosts, and all hosts in selected groups. This
is a hugh time-saver. Examples of how it can be used are:
The yellow circle indicates that the host or group has been selected.
MAT commands that are run when more than one item is selected will be run
on ALL selected hosts, and all hosts in selected groups. This
is a hugh time-saver. Examples of how it can be used are:
- Change the root password on all selected hosts, just by changing one.
- Add a local group, just by adding a local group to one machine.
- Edit a config file on one web server, and have the config changed on all your web servers.
- Add a MATd task to all selected hosts with a few clicks.
![]() This is a host icon.
Double-clicking on this icon will change the display to the host configuration
screen. Both the host and host group icons can be moved to any location
within the host window. This allows the placement of important systems
in a prominent position.
This is a host icon.
Double-clicking on this icon will change the display to the host configuration
screen. Both the host and host group icons can be moved to any location
within the host window. This allows the placement of important systems
in a prominent position.
![]() This is a host group it is
a container for other hosts and host groups. It allows the MAT hosts
to be placed in logical or organizational structures. The Test_Lab,
and Main_Servers are host groups. Double-clicking on a host group
will display the members of the group.
This is a host group it is
a container for other hosts and host groups. It allows the MAT hosts
to be placed in logical or organizational structures. The Test_Lab,
and Main_Servers are host groups. Double-clicking on a host group
will display the members of the group.

Hosts and groups are selected by right-clicking on them, or by middle-clicking, and selecting "Select All".
The bottom portion of the screen is used to display the results of some
MAT command. It is context sensitive. In this case it is displaying
the MAT hosts. The pointer was near the host localhost.
Double-clicking would bring up a GUI to edit it's properties.
